

Bitcoin price has fallen more than 1% below $66,000 as renewed U.S.-Iran threats have lifted oil prices and increased expectations for another Federal Reserve rate hike this year.
Summary
- Bitcoin price slipped below $66,000 as Trump’s latest Iran threat pressured risk assets.
- Rising oil prices pushed traders to increase bets on another Fed rate hike.
- BTC faces resistance near $67,300, while support sits between $64,500 and $65,500.
According to data from crypto.news, Bitcoin (BTC) price was trading near $65,700 on July 22 after reaching an intraday high of roughly $66,886, leaving the cryptocurrency under pressure as traders weighed another escalation around the Strait of Hormuz.
President Donald Trump warned in a Truth Social post that the United States would destroy one Iranian bridge or power plant each time Iran attacks a ship in the waterway. Trump added that the targets could include infrastructure located in or close to Tehran.

The warning followed the collapse of the interim ceasefire terms agreed under the Islamabad Memorandum of Understanding. The agreement, signed in June, called for the restoration of commercial traffic through Hormuz and the gradual removal of the U.S. naval blockade.
Iranian authorities have threatened to respond against regional infrastructure if Washington attacks the country’s bridges or electricity network, according to Iran’s Tasnim News Agency. Tasnim also reported that Iran’s Islamic Revolutionary Guard Corps had targeted Amazon data infrastructure in Bahrain during an earlier missile operation.
Shipping risks have increased further after Iran-backed Houthi forces threatened to block the Bab el-Mandeb Strait. Seven tankers had already changed course following the threat, which placed another key energy route under pressure while traffic through Hormuz remained disrupted.
Rising oil prices have revived inflation concerns
Brent crude climbed above $95 per barrel on July 22, reaching its highest point in six weeks as traders priced in risks to Gulf exports. Brent touched $95.24 before easing to about $94.40, representing a daily gain of more than 3%.
Around 20% of global petroleum consumption passes through the Strait of Hormuz, according to the U.S. Energy Information Administration. Continued disruption can therefore raise transport and fuel costs for countries that depend on Gulf oil, particularly if the Bab el-Mandeb route also faces restrictions.
Those energy risks have changed interest-rate expectations days before the Federal Open Market Committee meets on July 28–29. CME FedWatch data cited by MarketWatch placed the probability of a July increase at 33.7%, up from 25.7% one day earlier.
Polymarket traders, meanwhile, assigned a 65% probability to at least one Fed rate hike during 2026. The contract covers the rest of the year rather than only the July meeting, where futures traders continued to favor unchanged rates.
Before the latest oil increase, softer U.S. inflation data had reduced expectations for immediate tightening. A July 14 Reuters report showed that traders then assigned only a 10% chance to a July hike after annual headline inflation slowed to 3.5% in June from 4.2% in May.
The Federal Reserve’s June meeting minutes showed that policymakers were already watching energy-driven price pressure. Fed staff estimated that headline personal consumption expenditure inflation reached 4.1% in May, while core PCE inflation stood at 3.4%, according to the central bank.
Bitcoin price faces resistance between $67,000 and $69,340
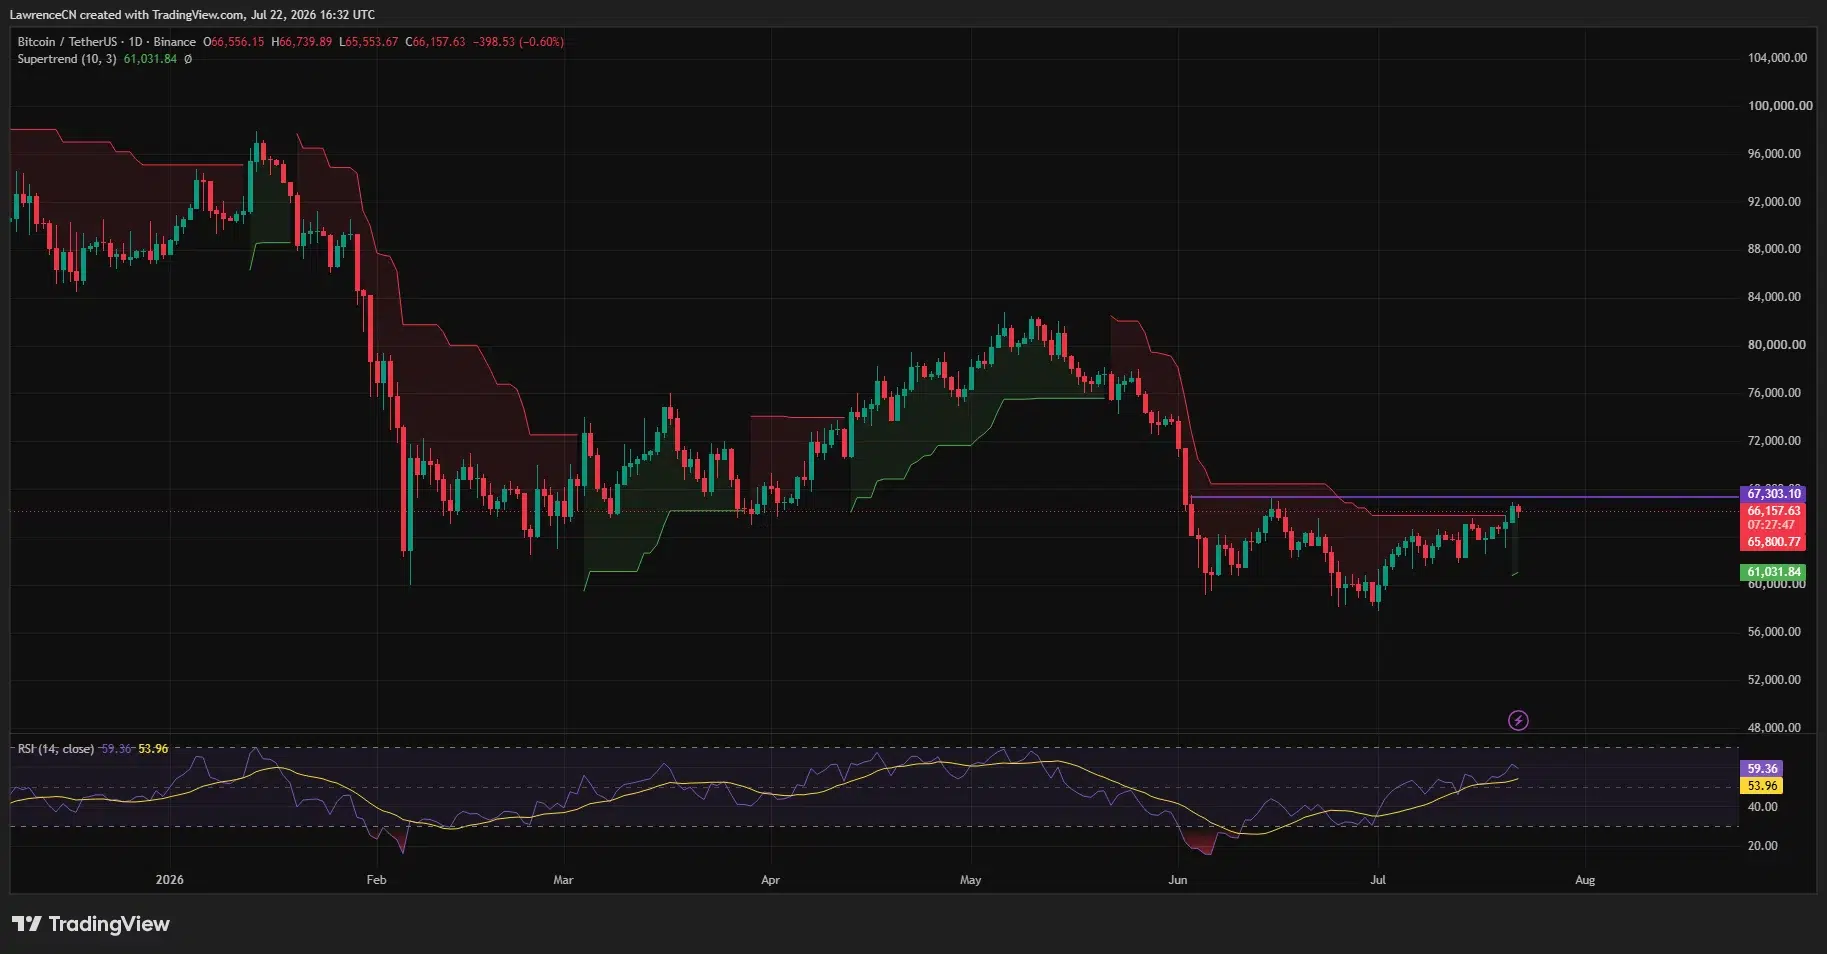
Bitcoin’s daily chart shows that price has remained below Supertrend resistance at $67,303 despite recovering from its late-June low near $58,000. The daily Relative Strength Index has risen to 59.36, above its signal average of 53.96, indicating improving momentum without reaching overbought territory.
On the 4-hour chart, BTC has traded inside an ascending channel since early July. Price recently tested the channel’s upper boundary near $66,986 before retreating, while the 78.6% Fibonacci retracement at $65,021 now forms the first visible support.
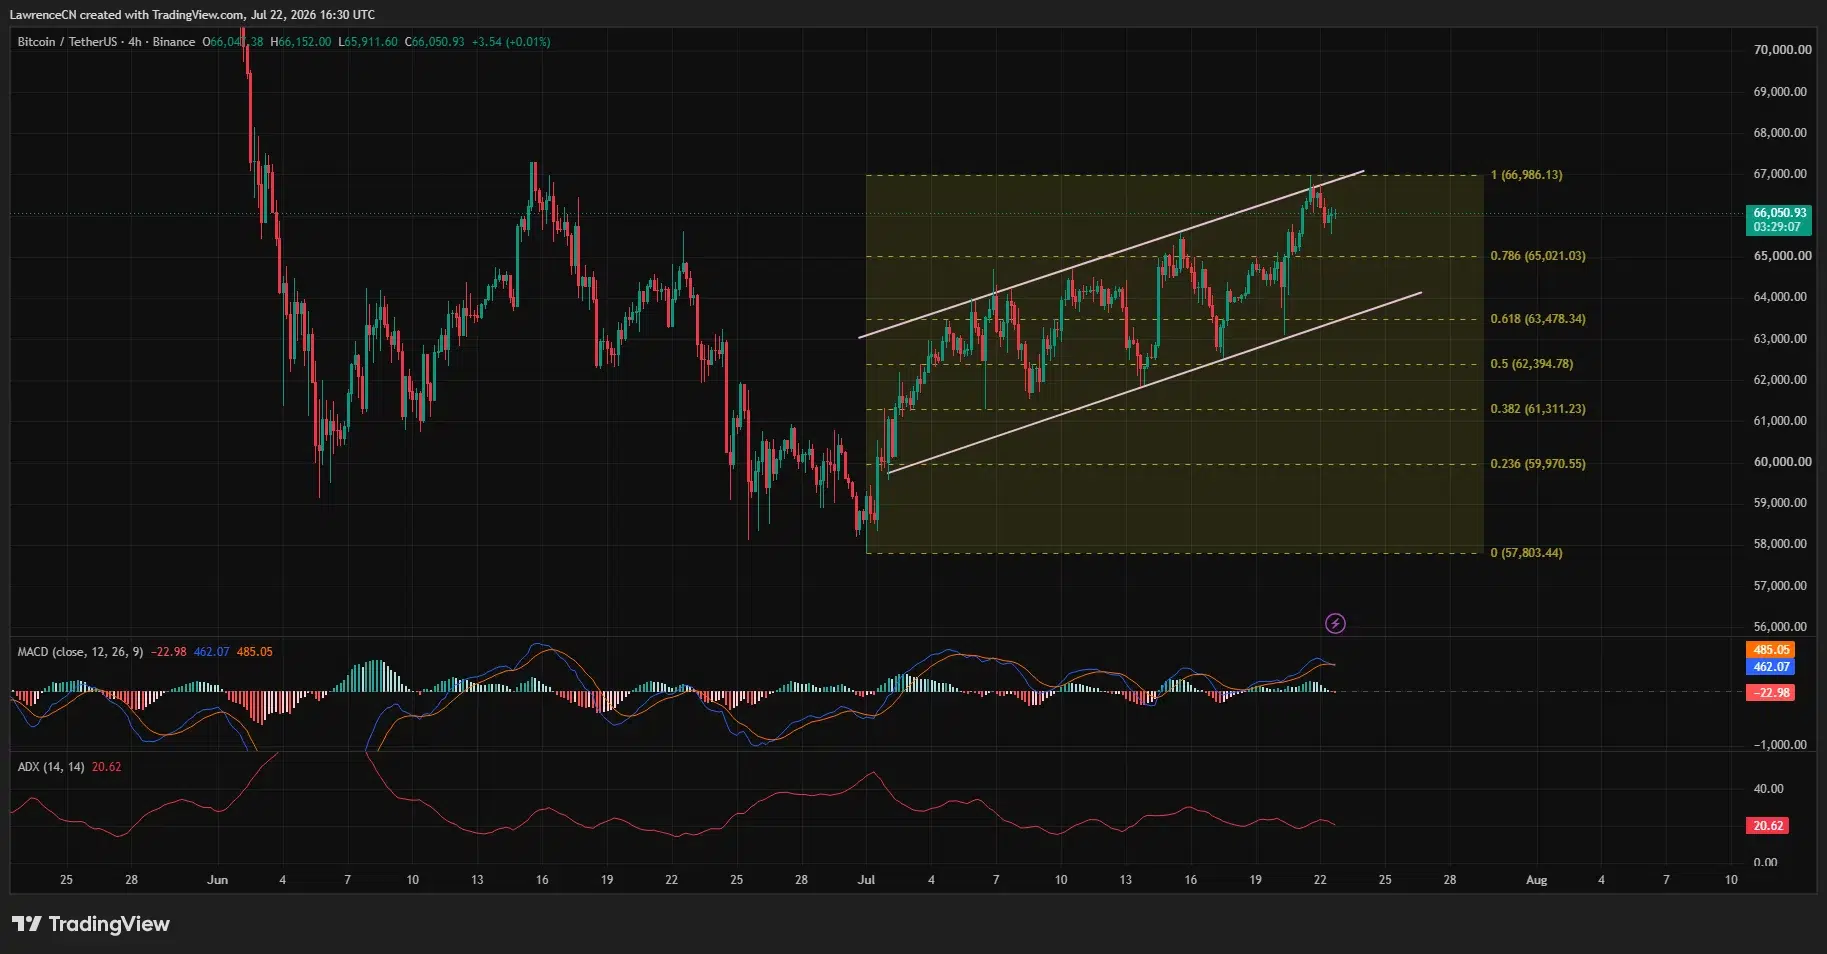
A deeper pullback would place the 61.8% retracement at $63,478 in focus, followed by the channel floor near $64,000. The 4-hour MACD histogram has moved slightly negative, and the MACD line has slipped below its signal line, showing that momentum weakened after the rejection near $67,000.
ADX has remained at 20.62, indicating that the current trend lacks strong directional force. A confirmed move above $66,986 and daily Supertrend resistance at $67,303 would be needed to improve the chart structure, while a break below $65,021 could expose the lower channel support.
Order-book data shared by crypto analyst Ted Pillows showed buy orders concentrated between $64,500 and $65,500, with sell orders stacked from $67,000 to $68,000. Commenting on the setup, Pillows wrote:
“If Bitcoin breaks above it, a rally to $70,000 will happen quick.”
Another barrier sits at $69,340, which crypto analyst Ali Charts identified as the short-term holder realized price. According to Ali, every Bitcoin rebound since November has been rejected around this on-chain cost basis, making the level an important test if buyers clear the immediate sell wall.
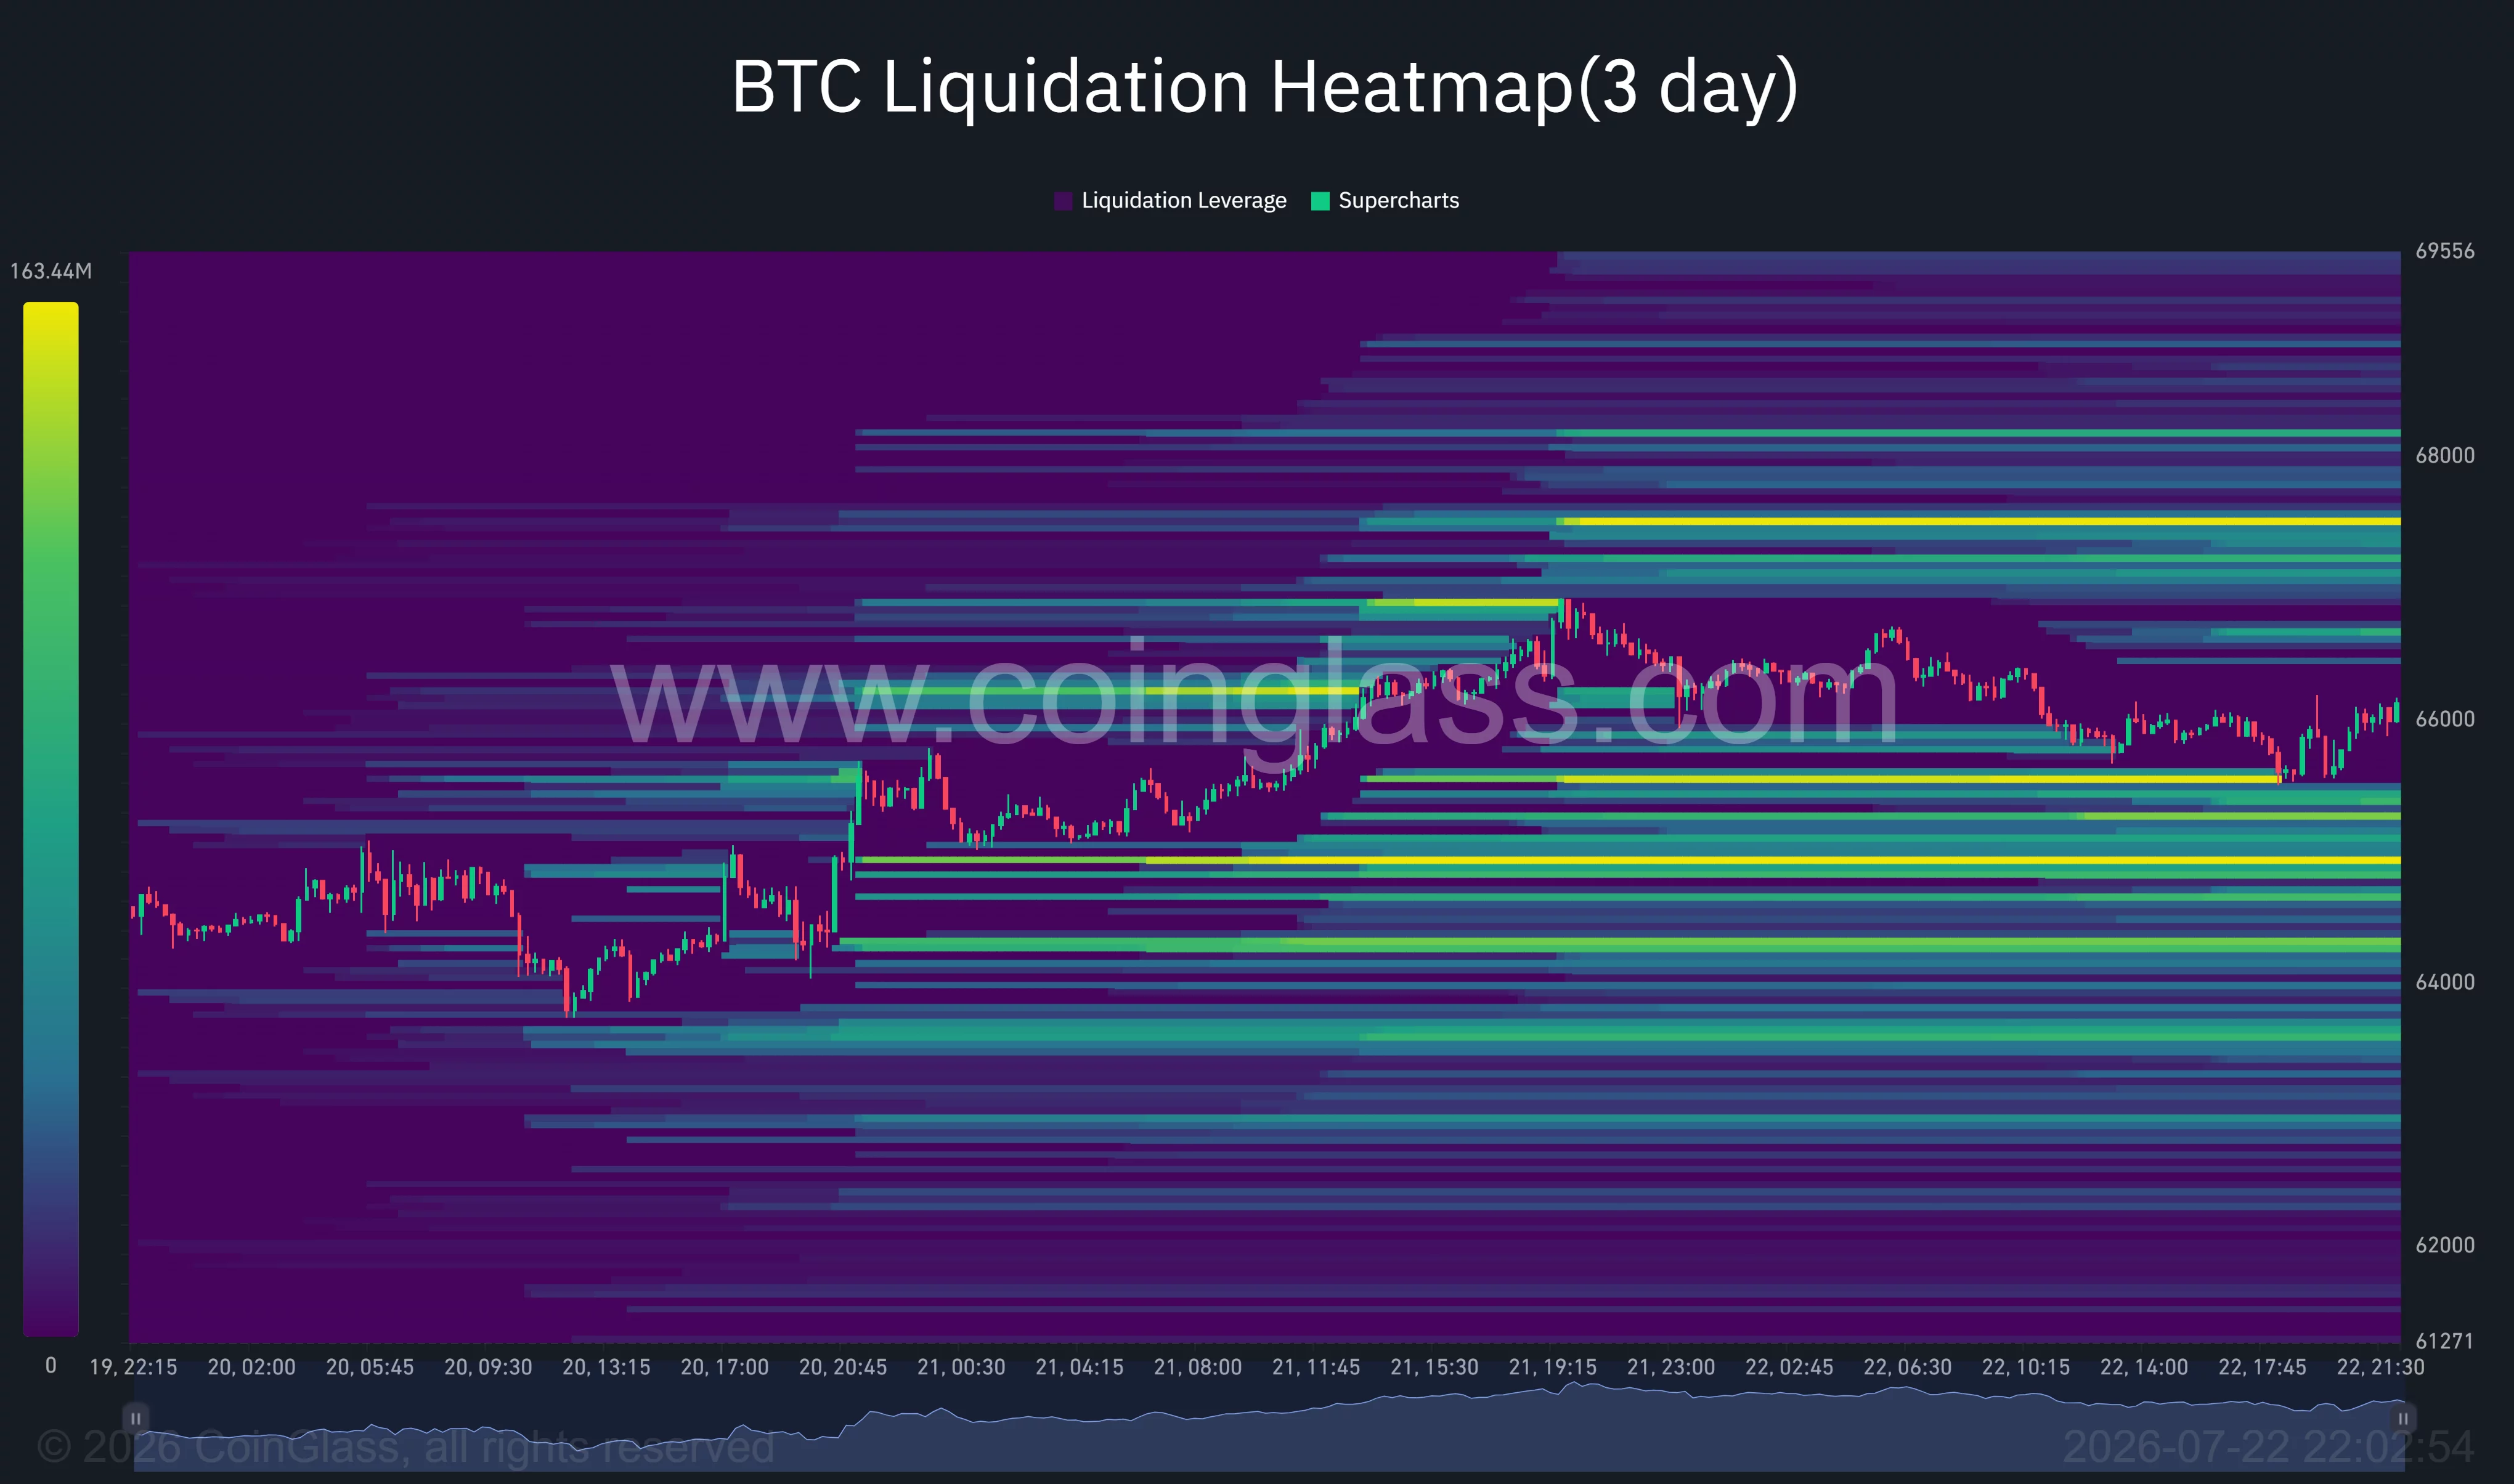
CoinGlass’s three-day liquidation heatmap supports the same resistance picture, showing the largest overhead liquidity cluster near $67,300, followed by dense positions around $68,000. Below the market, notable liquidation pools appear near $65,000, $64,400 and $63,500, leaving Bitcoin exposed to sharp moves in either direction as traders respond to oil prices, military developments and the July Fed decision.
Disclosure: This article does not represent investment advice. The content and materials featured on this page are for educational purposes only.
