


Bitcoin price hovered near $63,000 on Aug. 1 as US ETF outflows, weakening momentum and regulatory uncertainty kept buyers on the sidelines.
Summary
- Bitcoin price is testing the $63,150 Fibonacci support after retreating from July’s $66,900 high.
- US spot Bitcoin ETFs recorded $265 million in net outflows on July 31.
- 4-hour money flow fell to −0.22, indicating sustained selling pressure.
- Liquidation clusters near $62,000 and $65,000 could shape Bitcoin’s next move.
Bitcoin price struggles to hold $63,000
According to data from crypto.news, Bitcoin (BTC) price traded at approximately $63,082 at the time of writing after briefly falling below $63,000 during the latest selloff. The asset has now erased most of its recovery from the July 21 high near $66,900.
The daily chart places Bitcoin directly below the 78.6% Fibonacci retracement level at $63,150. This level is measured from the decline between the May peak of $82,492 and the June low of $57,884.
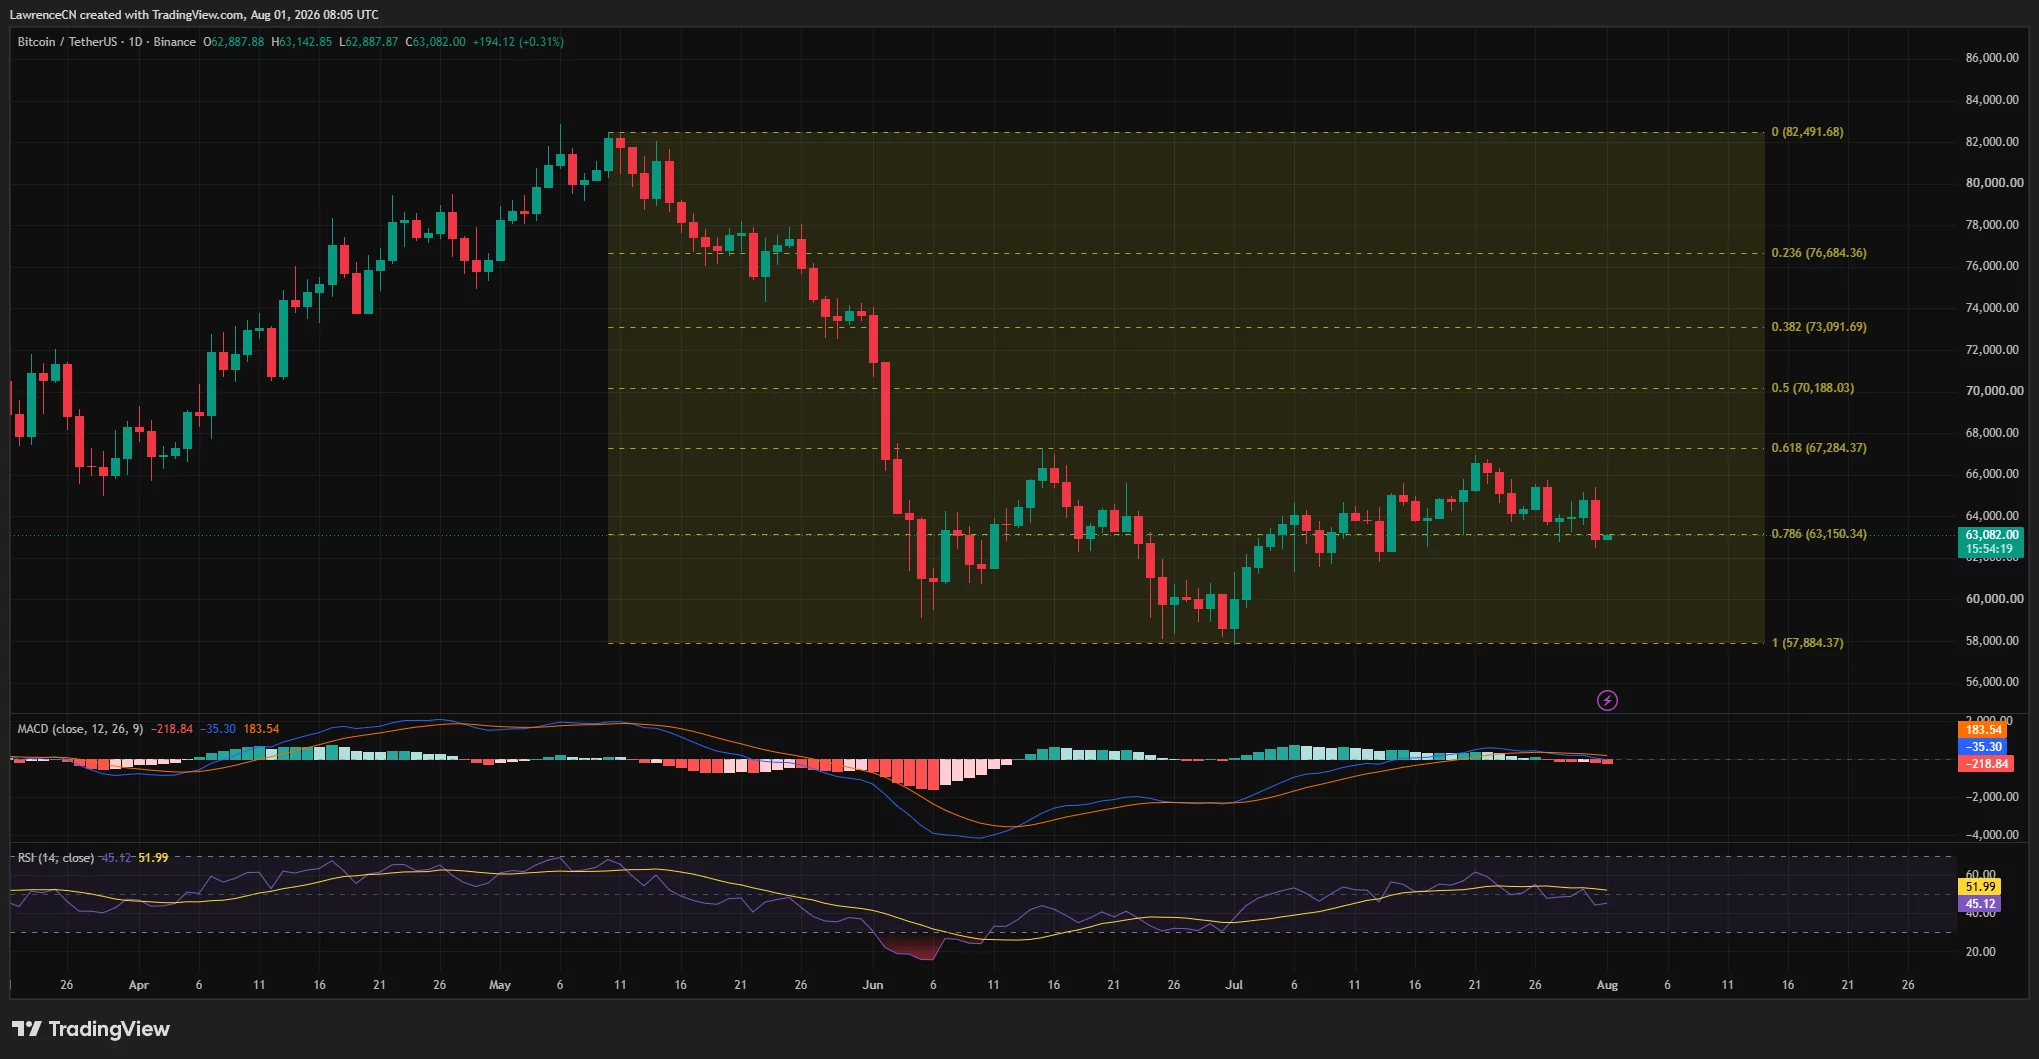
A daily close below $63,150 would confirm that buyers failed to defend the retracement level. Bitcoin could then retest the $62,000 area, followed by the psychological $60,000 support if selling accelerates.
Holding the current zone would leave room for another consolidation phase. However, Bitcoin must recover above $64,000 before the immediate pressure begins to ease.
Bitcoin momentum indicators turn bearish
Momentum readings on the daily and 4-hour charts favor sellers.
Bitcoin’s daily relative strength index has fallen to 45.12, below its moving average of 51.99. The reading is not yet oversold, meaning the market could decline further before reaching conditions that typically attract dip buyers.
The daily moving average convergence divergence indicator has also produced a bearish setup. The MACD line has crossed below its signal line, while the histogram has moved into negative territory at −218.84.
On the 4-hour chart, Bitcoin is trading below the Bollinger Band midpoint at $63,886 and close to the lower band at $62,489. The upper band near $65,284 marks the first major volatility-based resistance.
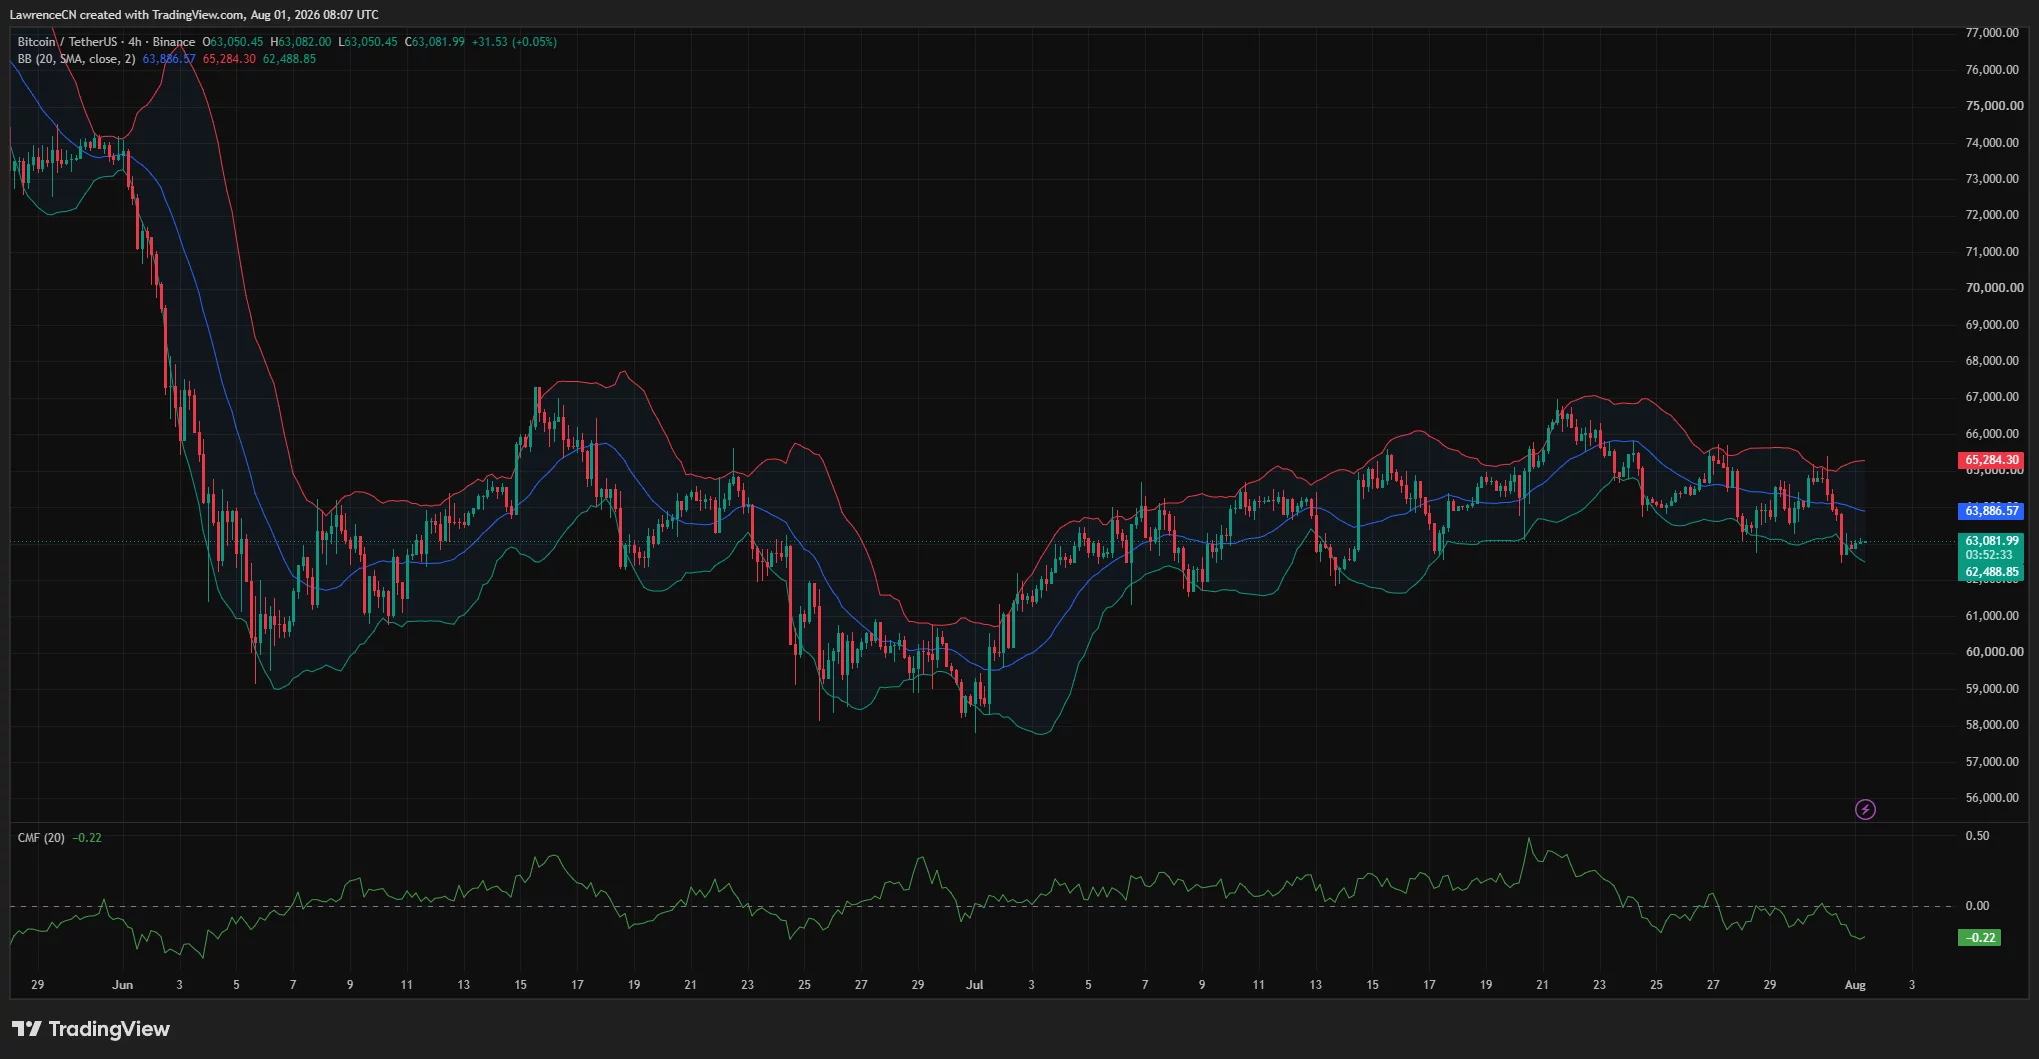
Chaikin Money Flow has dropped to −0.22 on the same timeframe. The negative reading indicates that capital is leaving Bitcoin as it trades near support, reducing the strength of any short-term recovery attempt.
ETF outflows add pressure on Bitcoin
US spot Bitcoin ETFs posted a combined net outflow of approximately $265 million on July 31, according to SoSoValue data.
BlackRock’s iShares Bitcoin Trust led the withdrawals with $123 million in net outflows. Fidelity’s FBTC followed with approximately $54.8 million.
The daily outflow ended a two-session inflow streak and showed that institutional demand remained fragile at the start of August. Total assets held by the US spot Bitcoin ETFs stood at approximately $76.29 billion, equivalent to 6.04% of Bitcoin’s market value.
Traders are also monitoring the CLARITY Act negotiations in Washington. The White House is expected to review a bipartisan ethics proposal as lawmakers seek enough support to move the market structure bill forward before the Senate’s August recess.
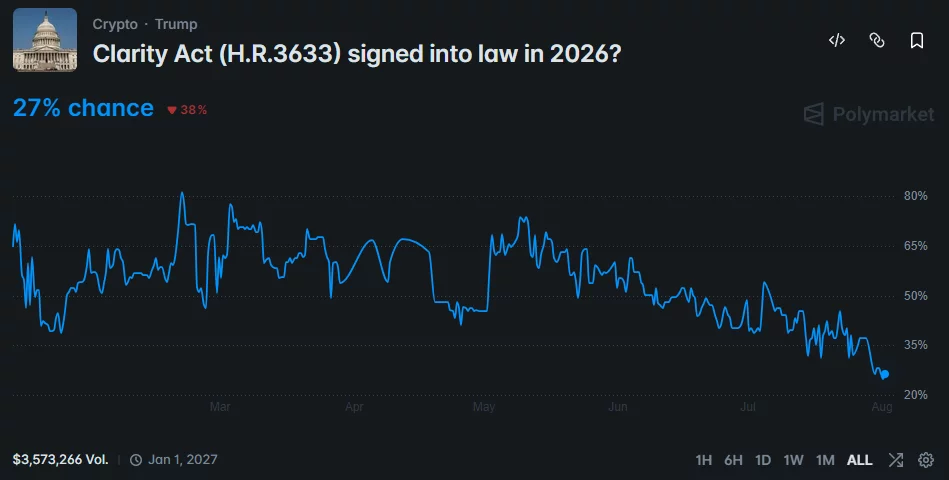
Polymarket traders placed the probability of the CLARITY Act becoming law in 2026 at just 27% on Aug. 1. Prediction-market odds reflect trader positioning rather than a reliable legislative forecast, but the decline points to limited confidence that lawmakers will resolve their differences quickly.
Liquidation map identifies $62K and $65K targets
Bitcoin’s one-week liquidation heatmap shows large concentrations of leveraged positions on both sides of the current price.
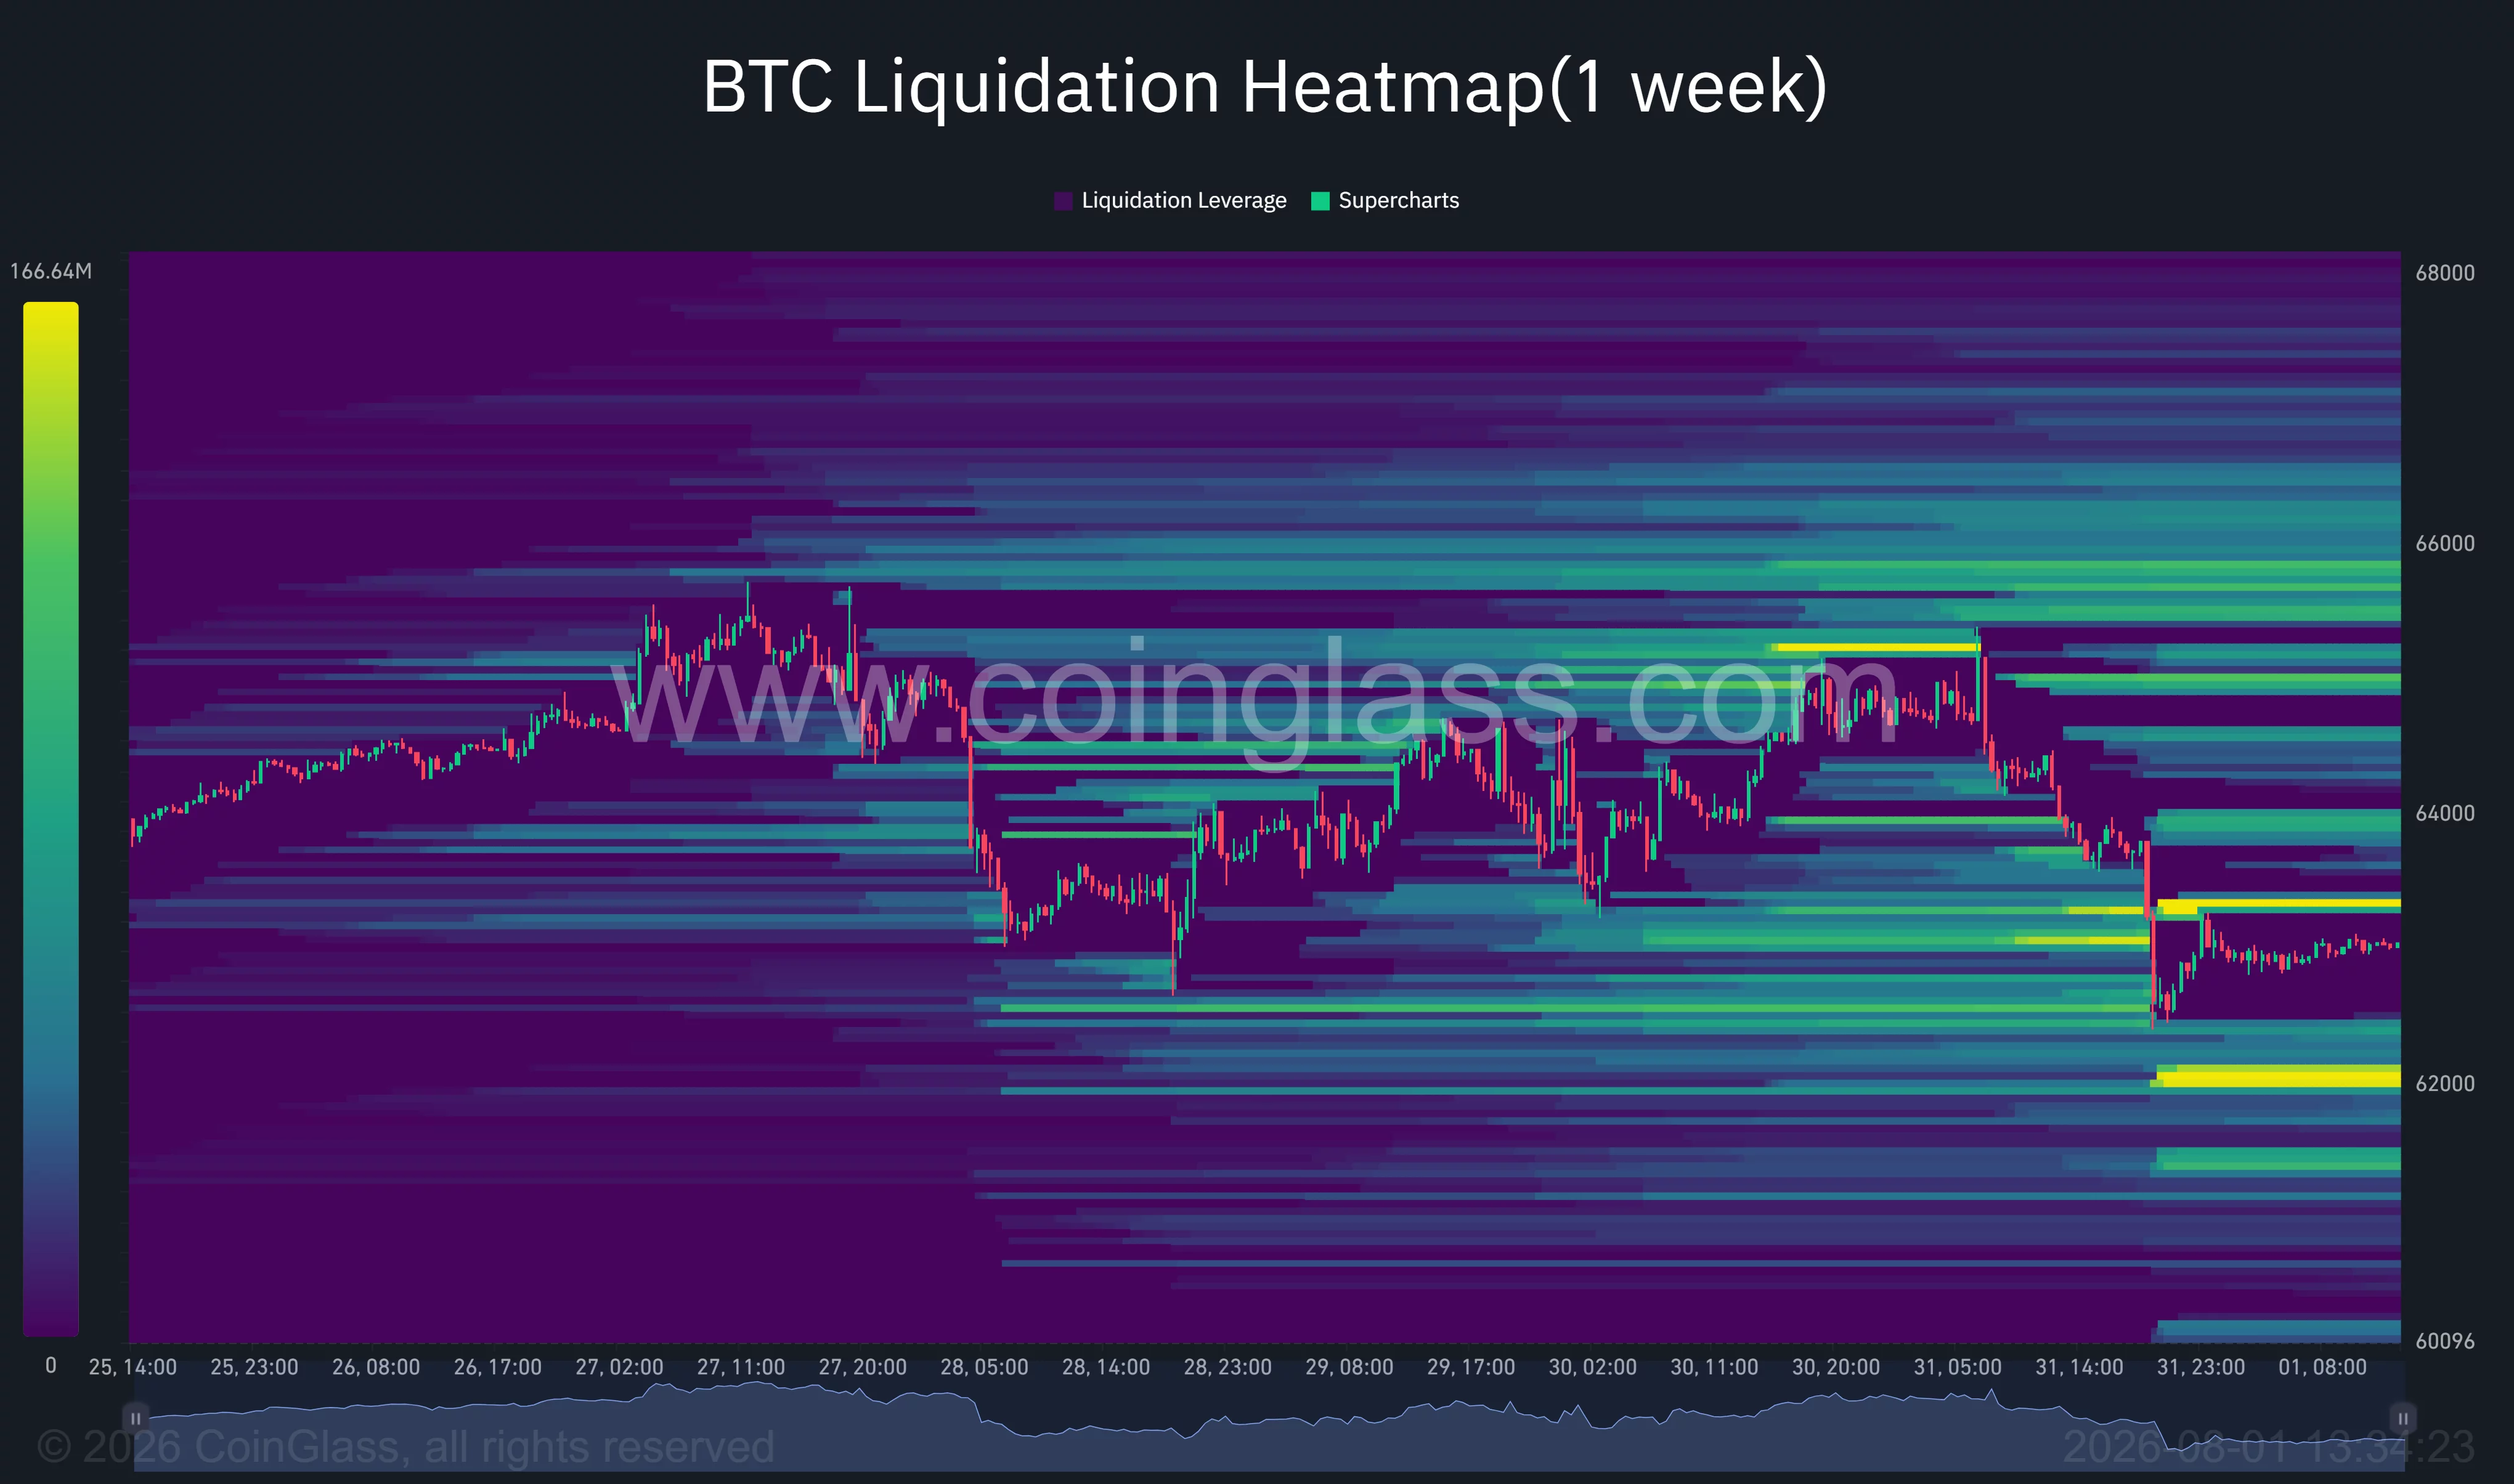
The nearest downside liquidity cluster sits around $62,000. A break below the 4-hour lower Bollinger Band at $62,489 could push Bitcoin toward this area as long positions are forced to close.
A smaller concentration appears near $63,300, which could act as an immediate target during a rebound. Above that level, the strongest nearby short-liquidation zones extend from approximately $65,000 to $66,000.
These concentrations can attract price as exchanges close leveraged positions, but they do not guarantee direction. Bitcoin could first sweep liquidity below $63,000 before attempting to recover, particularly while money flow remains negative.
Can Bitcoin price rebound toward $65,000?
Bitcoin needs to reclaim the 4-hour Bollinger midpoint near $63,886 to establish an initial recovery signal. A move above $64,000 would open a path toward $65,000 and the upper Bollinger Band at $65,284.
Clearing that area could trigger short liquidations and allow Bitcoin to retest $65,800 to $66,000. The broader recovery would remain incomplete until price breaks above the July high near $66,900 and the 0.618 Fibonacci level at $67,284.
Crypto analyst Ali Martinez also identified a TD Sequential sell signal on Bitcoin’s three-day chart.
“Bitcoin is flashing a warning sign,” Martinez said, adding that the signal appeared shortly before the start of August.
The TD Sequential attempts to identify trend exhaustion, but it does not independently confirm a decline. Bitcoin’s reaction at $63,150, ETF demand, and developments around the CLARITY Act will provide more immediate signals.
A sustained break below $62,000 would weaken the outlook and expose $60,000, followed by the June low near $57,884. Conversely, a recovery above $65,284 would reduce the immediate bearish pressure and shift attention back toward $67,284.
Disclosure: This article does not represent investment advice. The content and materials featured on this page are for educational purposes only.
