

Ethereum price trades within a rising wedge at $3,200, a bearish pattern signaling weakening momentum and raising the likelihood of a breakdown toward lower support regions.
Summary
- ETH forms a bearish rising wedge as price approaches the $3,200 region.
- Loss of the Value Area High and weak volume indicate structural weakness.
- Breakdown below the wedge and POC could accelerate a move toward $2,500 support.
Ethereum’s (ETH) price has recovered modestly from recent lows, but the structure of this rebound is flashing warning signs. The asset has rallied into a bearish rising wedge, a technical formation that often appears during corrective moves in broader downtrends.
With volume failing to support the latest upswing and key market profile levels remaining under pressure, the probability of a downside continuation is increasing. As ETH trades near $3,200, traders are closely monitoring structural signals that point to further weakness in the near term.
Ethereum price key technical points
- Ethereum is forming a bearish rising wedge, a continuation pattern favoring downside resolution.
- Loss of the Value Area High led to a new swing low, signaling structural weakness.
- Break below the wedge apex and Point of Control could accelerate a move toward $2,500 support.
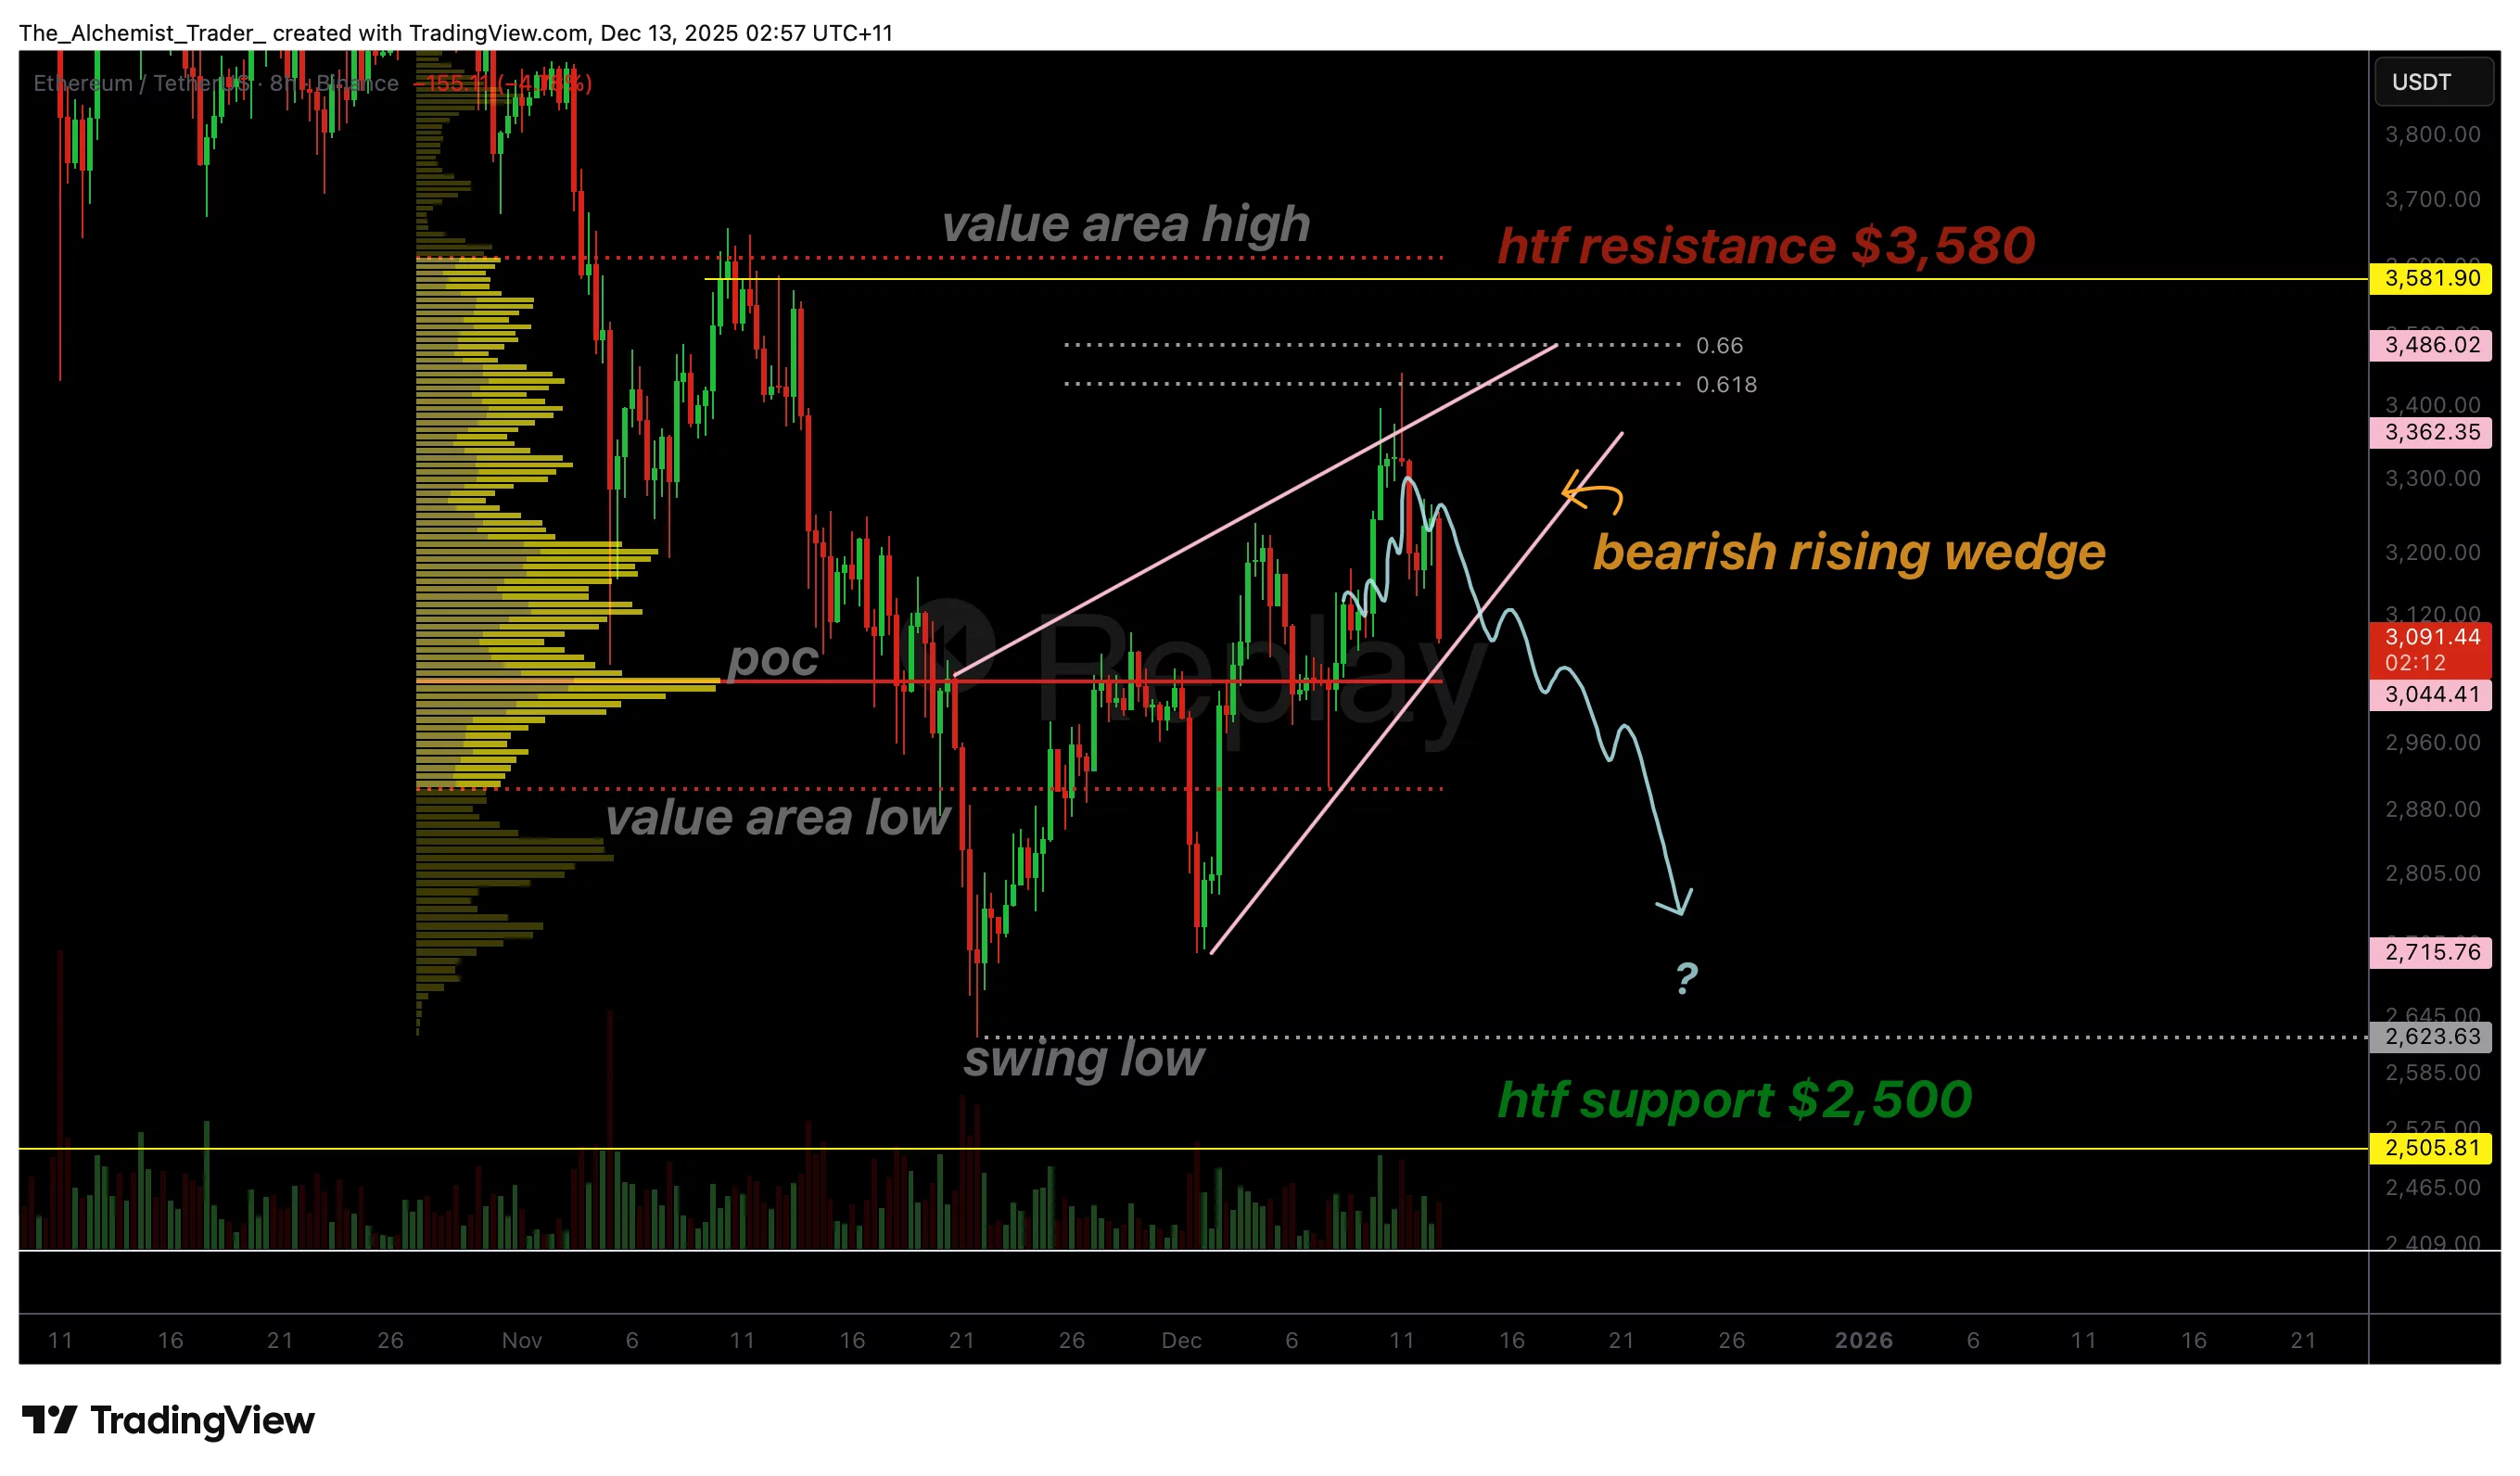
Ethereum recently rallied to the $3,200 region, but the structure of this move is unfavorable. The current formation, known as a bearish rising wedge, typically develops during retracement phases within a broader downtrend.
It is characterized by rising price action on weakening momentum, often leading to a sharp breakdown once support beneath the wedge fails, even as broader sentiment is influenced by developments such as WisdomTree’s debut of Europe’s first Lido-staked Ethereum ETP, which has not translated into meaningful bullish momentum on the chart.
This aligns with the broader context: ETH lost its Value Area High (VAH) earlier in the week, resulting in a clean move down to establish a new swing low. While the bounce from that level carried price back upward, the rally itself lacked any meaningful bullish volume, suggesting that buyers are not stepping in aggressively. When price rises without increasing volume, it reflects absorption rather than strong demand, an early sign that the move may not be sustainable.
The wedge itself contains an apex zone where the pattern is expected to resolve. This apex aligns closely with the 0.618 Fibonacci retracement, a level where price commonly stalls or reverses in corrective rallies. Compounding this setup is the presence of dynamic support rising beneath price. As this support converges with the apex, it creates a narrowing range that typically leads to a decisive breakout, most often to the downside in bearish rising wedge scenarios.
A key level to watch is the Point of Control (POC) within the current trading range. If Ethereum breaks down from the wedge and loses the POC, price action may accelerate rapidly as liquidity thins beneath this level. Loss of the POC removes the strongest volume node in the range, often resulting in sharp and directional moves as the market seeks the next area of interest.
In Ethereum’s case, the next major level sits at the $2,500 support zone, a high-time-frame technical region that has historically acted as a significant pivot. Should ETH lose the wedge support and fall below the POC, a rotational move toward $2,500 becomes the most probable scenario. This aligns with Ethereum’s macro market structure, which remains bearish with consecutive lower highs and lower lows.
What to expect in the coming price action
Ethereum is approaching a critical inflection point. A breakdown from the rising wedge, particularly if accompanied by a loss of the POC, would likely send the price toward the $2,500 support region. Unless bulls reclaim volume and break the wedge upward, downside continuation remains the dominant scenario.